


Cultivar Check Program | Final Report
Comprehensive midwestern multi-state evaluation of high cannabinoid hemp cultivars across consecutive growing seasons.
Introduction
At Oro-Verde Farms we are dedicated to the hemp sciences and bringing that research to not just farmers, but also people throughout the world who can benefit from this amazing plant. Hemp legalization has provided a unique opportunity to build an entirely new agriculture sector across food, fiber, and floral markets. Despite an overwhelming interest in hemp, there remains substantial uncertainty regarding agronomic best management practices for various types of hemp production. Additionally, concerns over regulatory compliance among the cultivars grown across the region poses additional challenges for growers.
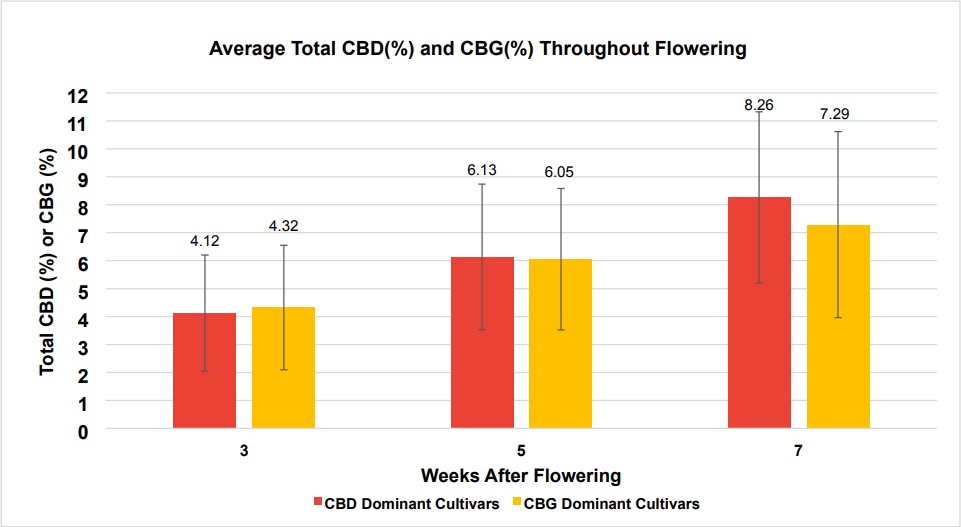
To address these issues, the Midwestern Hemp Research Collaborative (MHRC), a joint effort of land grant universities, non-profits, private laboratories and growers was formed. The MHRC conducts collaborative hemp research and outreach and maintains the Midwestern Hemp Database (MHD), which has become the largest public repository in the U.S. for information on hemp cultivar performance. This report will summarize findings from cooperative research trials which evaluated CBD-dominant/Chemotype III and CBG-dominant/Chemotype IV hemp cultivars across the growing seasons via the Cultivar Check Program (CCP).
Cultivar Check Program Overview
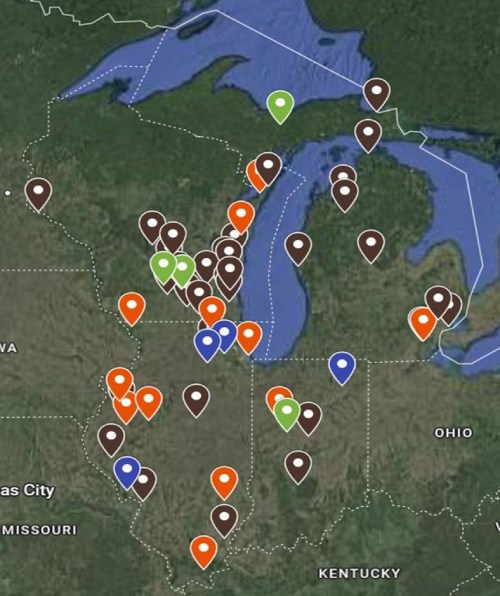
Established via a USDA Sustainable Agriculture Research and Education (SARE) Partnership Grant, the CCP operated as a series of participatory on-farm trials using an extensive grower-cooperator network across the Midwest. The main objective of these cultivar trials was to obtain data on the performance of high cannabinoid hemp cultivars across a range of latitudes/hardiness zones.
Program Dynamic Milestones
- Conducted trials via grower and researcher partnerships.
- 89 Site-Years across 4 States
- Evaluated 52 high cannabinoid hemp cultivars for agronomic performance, disease resistance, and cannabinoid development.
- 49 CBD-Dominant (Chemotype III)
- 3 CBG-Dominant (Chemotype IV)
- Analyse matrix verified over 1621 samples via partnership with Rock River Laboratories Inc.
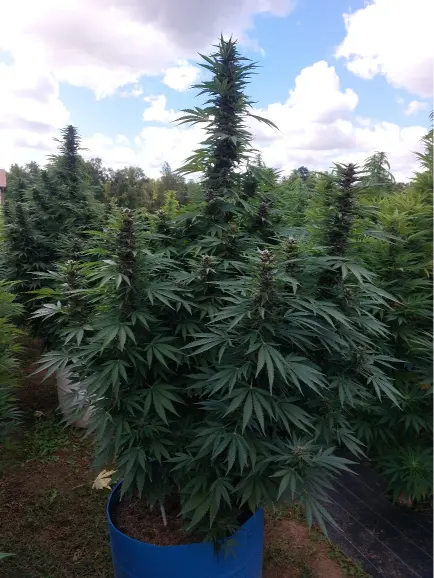
Field Performance Monitoring
Cultivars were chosen annually to be evaluated via the grower network based on prior performance, seed availability and grower/supplier interest. Evaluation metrics ensure clear insight for local organic adaptations.
Materials and Methods
Licensed hemp growers across the Midwest (Michigan, Illinois, Indiana, and Wisconsin) were recruited to participate in the CCP. Each grower received a subset of cultivars consisting of CBD Dominant (Chemotype III) and/or CBG Dominant (Chemotype IV) cultivars. Seedlings were established in late April or early May in indoor/greenhouse settings, and were allowed to develop in a greenhouse/hoop house for 4-5 weeks prior to a "hardening-off" period.
Following a one week hardening-off period ~15 healthy, representative seedlings from each cultivar were transplanted into the field in early to mid-June according to field conditions. Growers were responsible for submitting photographs, management updates, and performance data via SeedLinked®.
Following confirmation of flowering for each cultivar, growers submitted floral samples for cannabinoid analysis at three time points: 3 weeks, 5 weeks, and 7 weeks post flower initiation (~21 days, 35 days, and 49 days, respectively). Potency was evaluated using High-Performance Liquid Chromatography (HPLC) according to standard mathematical calculations:
Total THC = THC + (THCA * 0.877)
Total CBD = CBD + (CBDA * 0.877)
Statistical Analysis & General Ratios
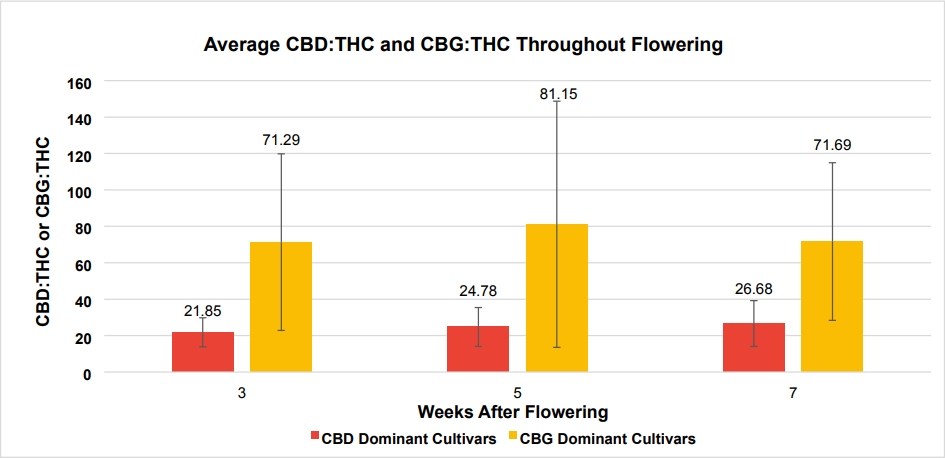
Average values for cannabinoids at each time point were determined and used to create compliance categories based on weeks into flowering. This was done in an attempt to simulate Performance-Based Sampling standards in accordance with USDA guidelines.
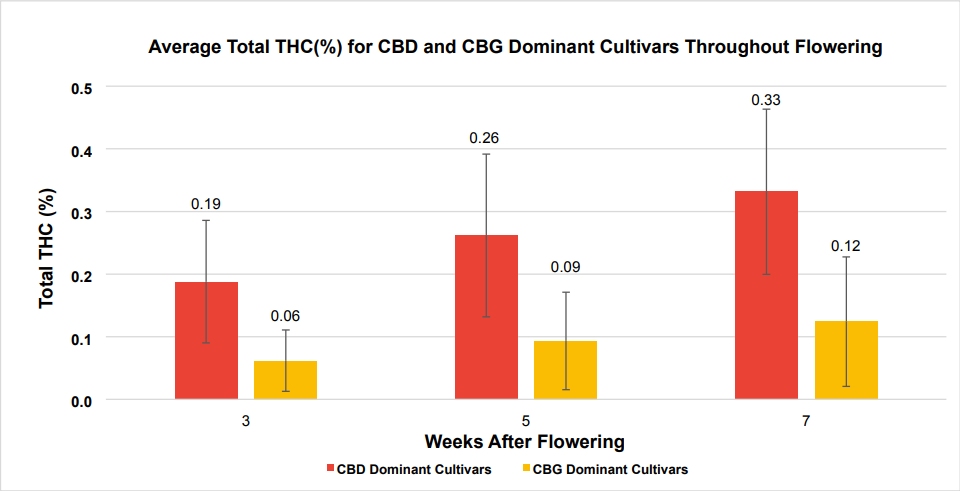
| Weeks After Flowering | Cannabinoid Interest / Chemotype | Total THC (%) Avg. | Total CBD (%) Avg. | CBD:THC Avg. | Total CBG (%) Avg. | CBG:THC Avg. | Samples (n) |
|---|---|---|---|---|---|---|---|
| 3 | CBD / Type III | 0.19c | 4.12c | 21.85c | - | - | 489 |
| 5 | CBD / Type III | 0.26b | 6.13b | 24.78b | - | - | 449 |
| 7 | CBD / Type III | 0.33a | 8.26a | 26.68a | - | - | 453 |
| 3 | CBG / Type IV | 0.06c | - | - | 4.32c | 71.29b | 81 |
| 5 | CBG / Type IV | 0.09b | - | - | 6.05b | 81.15a | 77 |
| 7 | CBG / Type IV | 0.12a | - | - | 7.29a | 71.69b | 71 |
Results / Discussion
The information synthesized from these trials marks a significant increase in regional hemp knowledge. In an effort to be concise, only cultivars with n > 5 samples per time point are shown in this report. For a complete set of cultivar performance data, please visit the MHD database.
Cannabinoid Development Trends
For CBD-dominant (Chemotype III) cultivars, both Total THC and Total CBD increased throughout the flowering period. Individual cultivar performance varied, but average values for Total THC and Total CBD at Week 7 post-terminal flower initiation were 0.33% and 8.26%, respectively. Most CBD-dominant hemp cultivars currently on the market will go "hot" (Total THC > 0.3%) if not monitored closely during flowering. To illustrate, 28 (57%) of the 49 CBD-dominant cultivars evaluated via the CCP exceeded the regulatory limit at some point during the flowering period.
Cultivar Performance & Compliance Schedule Matrix
Estimated compliance windows are defined as having an average Total THC < 0.32% (incorporating a 0.02% laboratory Measurement of Uncertainty). Color highlights indicate safe compliance limits: Purple (Compliance timeline limit marker).
| Cultivar | Seed Provider | Type | Weeks | CBD:THC Ratio | Total CBD (%) | Total CBG (%) | Total THC (%) Avg | Total THC (%) Std | Samples (n) | Status Limit |
|---|---|---|---|---|---|---|---|---|---|---|
| Abacus | Arrowhead Seed Co. | CBD/Type III | 3 | 21.85 | 5.82 | 0.36 | 0.27 | 0.07 | 9 | Week 5 Max |
| Abacus | Arrowhead Seed Co. | CBD/Type III | 5 | 23.28 | 9.16 | 0.55 | 0.39 | 0.07 | 8 | Week 5 Max |
| Abacus | Arrowhead Seed Co. | CBD/Type III | 7 | 24.56 | 11.21 | 0.52 | 0.46 | 0.07 | 5 | Week 5 Max |
| ArkRyder | High Grade Hemp Seed | CBD/Type III | 3 | 21.51 | 3.27 | 0.85 | 0.18 | 0.09 | 6 | Compliant W7 |
| ArkRyder | High Grade Hemp Seed | CBD/Type III | 5 | 28.48 | 6.69 | 0.80 | 0.28 | 0.11 | 6 | Compliant W7 |
| ArkRyder | High Grade Hemp Seed | CBD/Type III | 7 | 33.98 | 7.76 | 0.98 | 0.30 | 0.11 | 5 | Compliant W7 |
| BaOX Hybrid | Arrowhead Seed Co. | CBD/Type III | 3 | 26.00 | 3.49 | 0.19 | 0.10 | 0.08 | 17 | Compliant W7 |
| BaOX Hybrid | Arrowhead Seed Co. | CBD/Type III | 5 | 28.70 | 5.16 | 0.18 | 0.16 | 0.09 | 12 | Compliant W7 |
| BaOX Hybrid | Arrowhead Seed Co. | CBD/Type III | 7 | 29.33 | 8.13 | 0.32 | 0.29 | 0.15 | 15 | Compliant W7 |
| Badger 5 | Wisconsin Crop Innovation | CBD/Type III | 3 | 30.80 | 4.35 | 0.23 | 0.15 | 0.07 | 11 | Week 5 Max |
| Badger 5 | Wisconsin Crop Innovation | CBD/Type III | 5 | 23.79 | 5.76 | 0.30 | 0.25 | 0.14 | 12 | Week 5 Max |
| Badger 5 | Wisconsin Crop Innovation | CBD/Type III | 7 | 26.80 | 8.66 | 0.40 | 0.33 | 0.10 | 44 | Week 5 Max |
| Blue Merengue | High Alpine Genetics | CBD/Type III | 3 | 31.09 | 3.78 | 0.31 | 0.17 | 0.11 | 7 | Compliant W7 |
| Blue Merengue | High Alpine Genetics | CBD/Type III | 5 | 29.26 | 4.65 | 0.38 | 0.21 | 0.11 | 6 | Compliant W7 |
| Blue Merengue | High Alpine Genetics | CBD/Type III | 7 | 30.78 | 7.85 | 0.42 | 0.31 | 0.10 | 7 | Compliant W7 |
| Matterhorn CBG | High Grade Hemp Seed | CBG/Type IV | 3 | 3.37 | 0.14 | 2.22 | 0.05 | 0.03 | 12 | Compliant W7 |
| Matterhorn CBG | High Grade Hemp Seed | CBG/Type IV | 5 | 2.66 | 0.18 | 3.85 | 0.08 | 0.04 | 12 | Compliant W7 |
| Matterhorn CBG | High Grade Hemp Seed | CBG/Type IV | 7 | 3.16 | 0.16 | 4.21 | 0.08 | 0.04 | 12 | Compliant W7 |
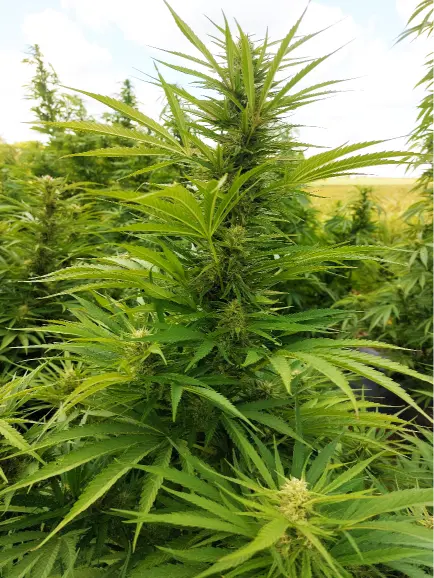
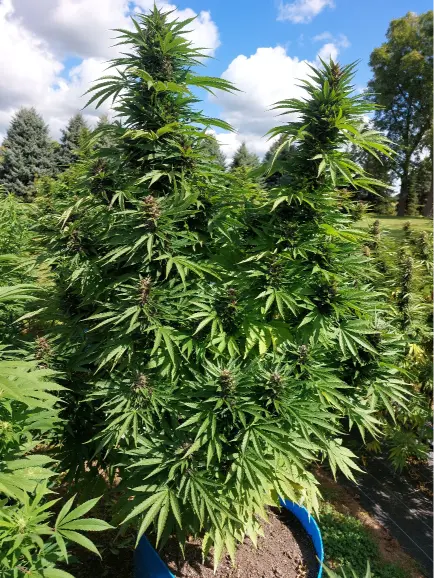
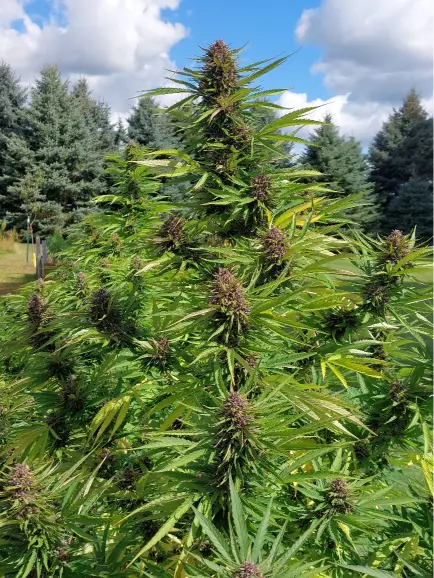
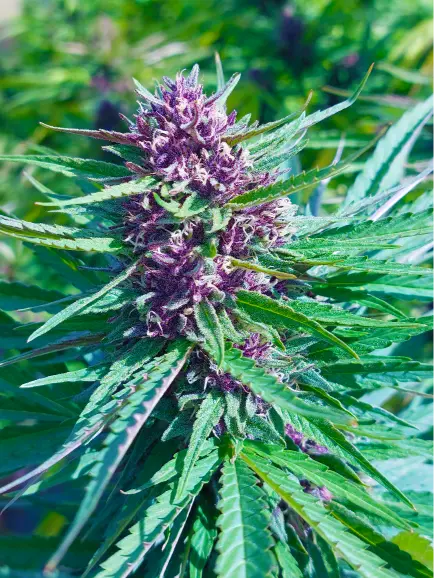
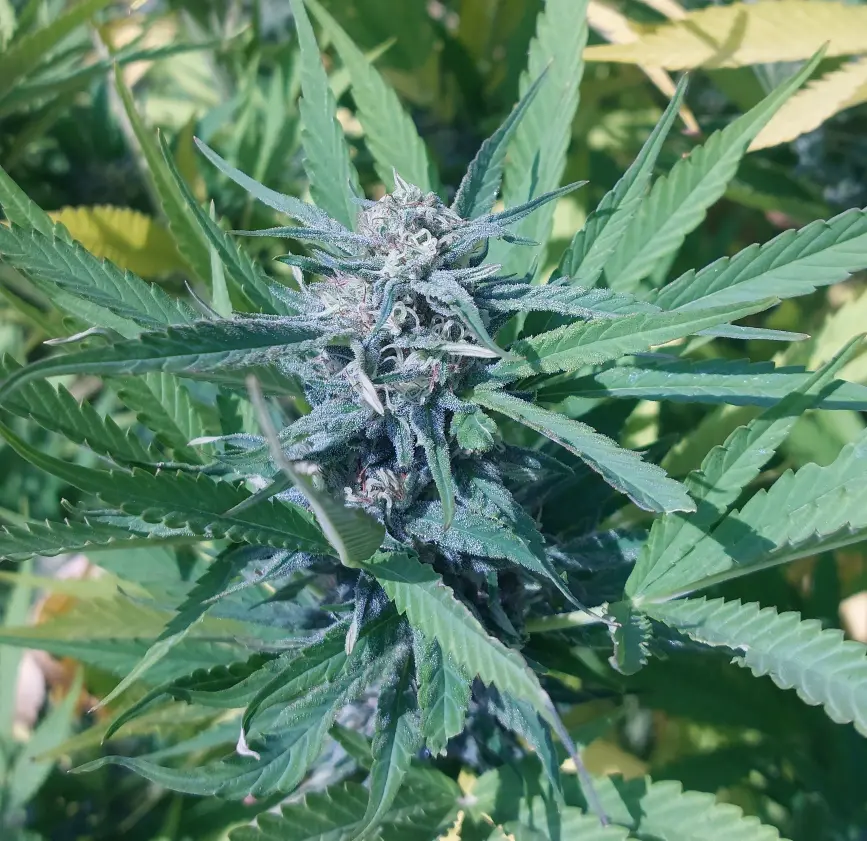
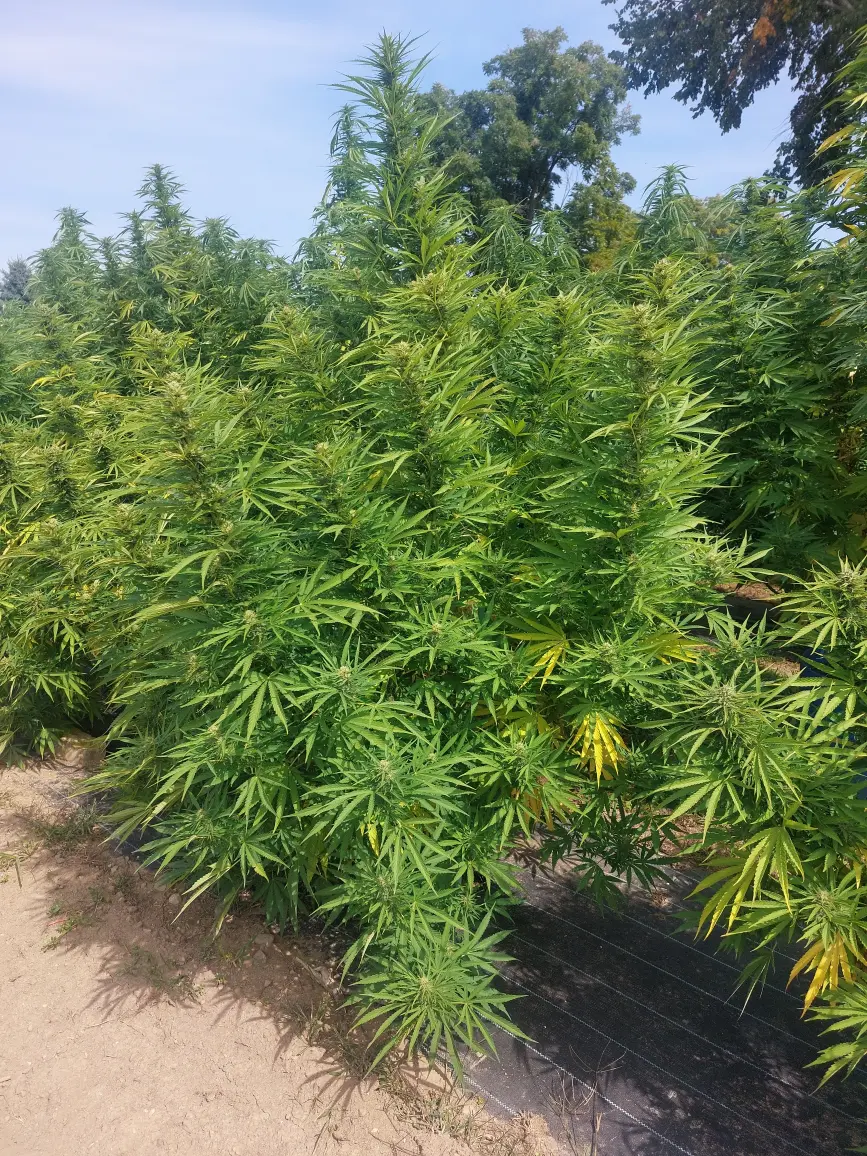
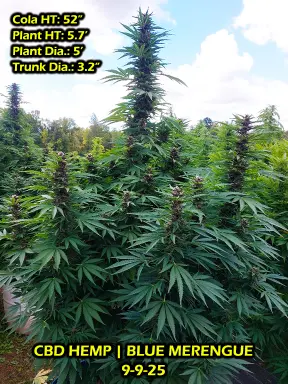
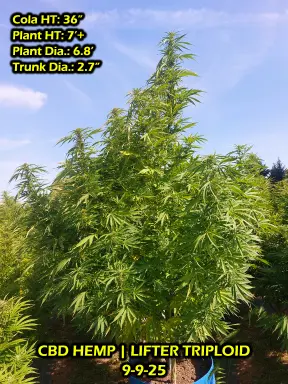
Field Gallery & Cultivar Morphologies
Visual database archive displaying structural development and uniform floral profiles across selected test locations.
Additional Information / References
-
Alberti, P., et al. 2024. Cultivar Check Program 2023 Research Report. University of Wisconsin Extension Publication.
https://cropsandsoils.extension.wisc.edu/files/2024/01/2023-Cultivar-Check-Report-Final.pdf -
Alberti, P., et al. 2023. Cultivar Check Program 2022 Research Report. University of Wisconsin Extension Publication.
https://cropsandsoils.extension.wisc.edu/files/2024/01/2022-Research-Report-Cultivar-Check-Program.pdf -
Alberti, P., et al. 2022. Cultivar Check Program 2021 Research Report. University of Illinois Extension Publication.
https://extension.illinois.edu/sites/default/files/2021_research_update_-_cultivar_check_program.pdf -
Alberti, P., et al. 2022. Midwestern Hemp Database 2021 Research Report. University of Illinois Extension Publication.
https://extension.illinois.edu/sites/default/files/mhd_2021_research_report.pdf -
Alberti, P., et al. 2021. “Midwestern Hemp Database 2020 Research Report.”
https://extension.illinois.edu/sites/default/files/4.7.21mhd_2020_report_0.pdf -
Campbell, B.J., et al. 2019. “Genotype Environment Interactions of Industrial Hemp Cultivars Highlight Diverse Responses to Environmental Factors.” Agrosystems, Geosciences & Environment, 2:1, 1–11.
https://doi.org/10.2134/age2018.11.0057 -
DeDecker, J., et al. 2021. “Hemp Tribal Research Initiative for Michigan (TRIM) 2020 CBD Hemp Cultivar Trial.”
https://www.canr.msu.edu/uprc/uploads/files/2020%20CBD%20Hemp%20Report.pdf -
Ellison, S., et al. 2021. “2020 UW Madison– Wisconsin Hemp Cultivar Trial.”
https://cropsandsoils.extension.wisc.edu/files/2023/08/2020-UW-Madison-Wisconsin-Hemp-Cultivar-Trial.pdf -
Fournier, G., et al. 1987. “Identification of a New Chemotype in Cannabis sativa: Cannabigerol - Dominant Plants, Biogenetic and Agronomic Prospects.”
https://www.thieme-connect.com/products/ejournals/abstract/10.1055/s-2006-962705 -
Midwestern Hemp Database. 2025. University of Wisconsin-Madison. High Cannabinoid Database–Crops and Soils.
https://cropsandsoils.extension.wisc.edu/midwestern-hemp-database/ -
Pacifico, D., et al. 2007. “Time course of cannabinoid accumulation and chemotype development during the growth of Cannabis sativa L.”
https://link.springer.com/article/10.1007/s10681-007-9543-y -
Toth, J.A., et al. 2021. “Limited Effect of Environmental Stress on Cannabinoid Profiles in High Cannabidiol Hemp (Cannabis Sativa L.).” GCB Bioenergy, 13:10, 1666–1674.
https://doi.org/10.1111/gcbb.12880
Acknowledgments
This work was supported by the Sustainable Agriculture Research and Education (SARE) Partnership Grant, project award no. ONC23-117 from the U.S. Department of Agriculture's National Institute of Food and Agriculture. Additional support from Rock River Laboratory Inc. was provided; special thanks to Lab Director, Dustin Sawyer who made this project a reality.